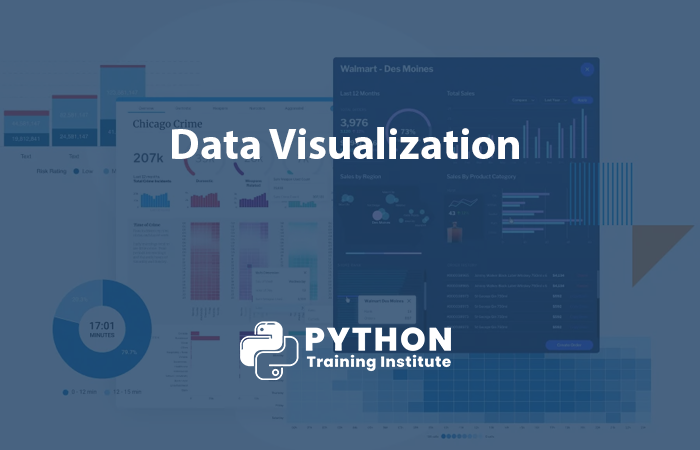
Data Visualization Course in Pune
Launch your data analytics career with Python Training Institute in Pune, mastering Data Visualization, Tableau, Power BI, and Python in Kharadi, Pune’s thriving tech ecosystem.
25+ Lessons
60hrs
12,000+ Students Enrolled
4.8 (5000 Ratings)
Our Data Visualization training in Pune offers a comprehensive curriculum, covering Tableau, Power BI, and Python libraries like Matplotlib and Seaborn. With hands-on projects and 100% placement support, you’ll excel in Pune’s data-driven tech hub.
Achieve Your Dream Data Analytics Career in 60 Days
1000+ Leading Universities And Companies


Our Data Visualization Graduates Thriving in Pune
Join thousands of alumni who secured top data analytics roles after completing our Data Visualization training programs.


Learn at Python Training Institute & Get Your
Get Your Dream IT Job in 90 Days
like these Successful Students!
Join our Python Full Stack Development course and gain the skills to excel in the tech industry.
Enroll Now